Note
Click here to download the full example code
GroupLasso for logistic regression
A sample script for group lasso regression
Setup
import matplotlib.pyplot as plt
import numpy as np

from group_lasso import LogisticGroupLasso

np.random.seed(0)
LogisticGroupLasso.LOG_LOSSES = True
Set dataset parameters
group_sizes = [np.random.randint(10, 20) for i in range(50)]
active_groups = [np.random.randint(2) for _ in group_sizes]
groups = np.concatenate([size * [i] for i, size in enumerate(group_sizes)])
num_coeffs = sum(group_sizes)
num_datapoints = 10000
noise_std = 1
Generate data matrix
X = np.random.standard_normal((num_datapoints, num_coeffs))
Generate coefficients
w = np.concatenate(
    [
        np.random.standard_normal(group_size) * is_active
        for group_size, is_active in zip(group_sizes, active_groups)
    ]
)
w = w.reshape(-1, 1)
true_coefficient_mask = w != 0
intercept = 2
Generate regression targets
y_true = X @ w + intercept
y = y_true + np.random.randn(*y_true.shape) * noise_std
p = 1 / (1 + np.exp(-y))
p_true = 1 / (1 + np.exp(-y_true))
c = np.random.binomial(1, p_true)
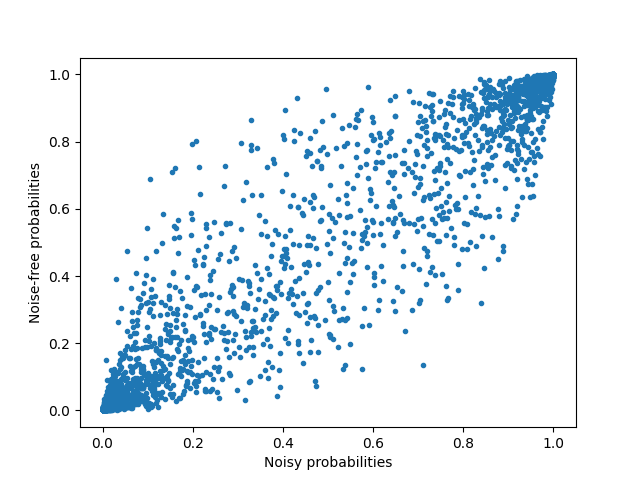
View noisy data and compute maximum accuracy
plt.figure()
plt.plot(p, p_true, ".")
plt.xlabel("Noisy probabilities")
plt.ylabel("Noise-free probabilities")
# Use noisy y as true because that is what we would have access
# to in a real-life setting.
best_accuracy = ((p_true > 0.5) == c).mean()
Generate estimator and train it
gl = LogisticGroupLasso(
    groups=groups,
    group_reg=0.05,
    l1_reg=0,
    scale_reg="inverse_group_size",
    subsampling_scheme=1,
    supress_warning=True,
)

gl.fit(X, c)
Out:
/home/docs/checkouts/readthedocs.org/user_builds/group-lasso/envs/latest/lib/python3.7/site-packages/group_lasso-1.5.0-py3.7.egg/group_lasso/_group_lasso.py:839: UserWarning: Subsampling is not stable for logistic regression group lasso.
/home/docs/checkouts/readthedocs.org/user_builds/group-lasso/envs/latest/lib/python3.7/site-packages/group_lasso-1.5.0-py3.7.egg/group_lasso/_fista.py:119: ConvergenceWarning: The FISTA iterations did not converge to a sufficient minimum.
You used subsampling then this is expected, otherwise, try increasing the number of iterations or decreasing the tolerance.

LogisticGroupLasso(groups=array([ 0,  0,  0,  0,  0,  0,  0,  0,  0,  0,  0,  0,  0,  0,  0,  1,  1,
        1,  1,  1,  1,  1,  1,  1,  1,  2,  2,  2,  2,  2,  2,  2,  2,  2,
        2,  2,  2,  2,  3,  3,  3,  3,  3,  3,  3,  3,  3,  3,  3,  3,  3,
        4,  4,  4,  4,  4,  4,  4,  4,  4,  4,  4,  4,  4,  4,  4,  4,  4,
        5,  5,  5,  5,  5,  5,  5,  5,  5,  5,  5,  5,  5,  5,  5,  5,  5,
        5,  5,  6,  6,  6,  6,  6,  6,  6,  6,  6,  6,  6,  6,  6,  7,  7,
        7,  7,  7,  7,  7,  7,  7,  7,  7,  7,  7,  7,  7,  8,  8,  8,  8,
        8,  8,  8,  8,  8,  8,  8,  8,  9,  9,  9,  9,  9,  9,  9,  9,  9,
        9,  9,  9,  9,  9, 10, 10, 10, 10, 10, 10, 10, 10, 10, 10, 10, 10...
       43, 43, 43, 43, 43, 43, 43, 43, 43, 43, 44, 44, 44, 44, 44, 44, 44,
       44, 44, 44, 44, 44, 44, 44, 44, 44, 44, 45, 45, 45, 45, 45, 45, 45,
       45, 45, 45, 45, 45, 45, 46, 46, 46, 46, 46, 46, 46, 46, 46, 46, 46,
       46, 47, 47, 47, 47, 47, 47, 47, 47, 47, 47, 47, 47, 47, 47, 47, 47,
       47, 48, 48, 48, 48, 48, 48, 48, 48, 48, 48, 48, 48, 49, 49, 49, 49,
       49, 49, 49, 49, 49, 49]),
                   l1_reg=0, scale_reg='inverse_group_size',
                   subsampling_scheme=1, supress_warning=True)
Extract results and compute performance metrics
# Extract info from estimator
pred_c = gl.predict(X)
sparsity_mask = gl.sparsity_mask_
w_hat = gl.coef_

# Compute performance metrics
accuracy = (pred_c == c).mean()

# Print results
print(f"Number variables: {len(sparsity_mask)}")
print(f"Number of chosen variables: {sparsity_mask.sum()}")
print(f"Accuracy: {accuracy}, best possible accuracy = {best_accuracy}")
Out:
Number variables: 720
Number of chosen variables: 292
Accuracy: 0.504607, best possible accuracy = 0.9698
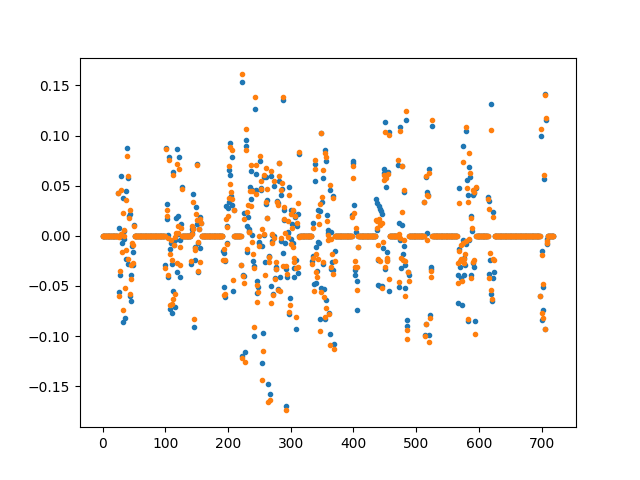
Visualise regression coefficients
coef = gl.coef_[:, 1] - gl.coef_[:, 0]
plt.figure()
plt.plot(w / np.linalg.norm(w), ".", label="True weights")
plt.plot(
coef / np.linalg.norm(coef), ".", label="Estimated weights",
)
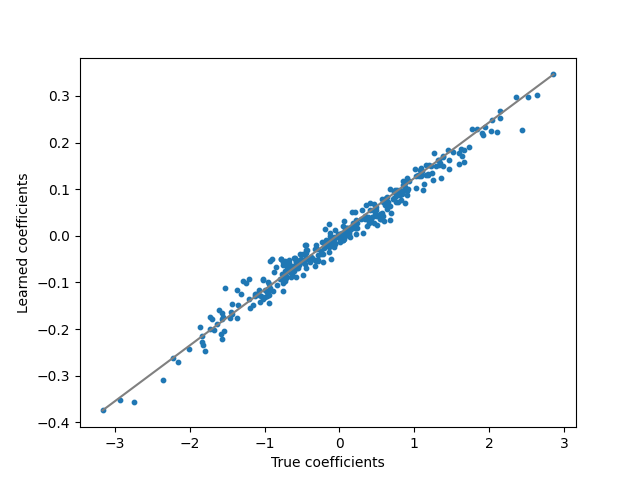
plt.figure()
plt.plot([w.min(), w.max()], [coef.min(), coef.max()], "gray")
plt.scatter(w, coef, s=10)
plt.ylabel("Learned coefficients")
plt.xlabel("True coefficients")
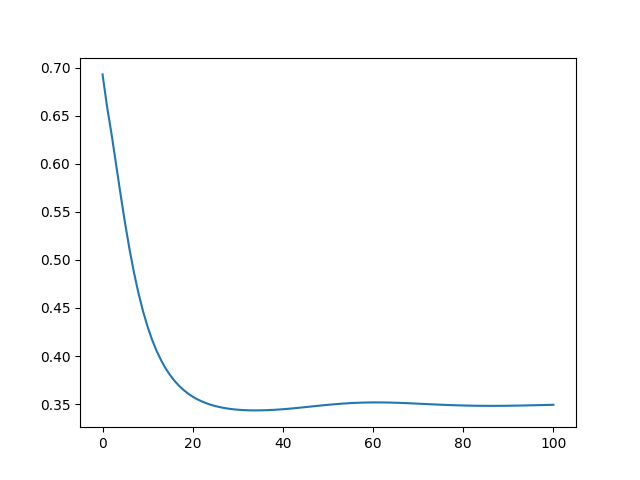
plt.figure()
plt.plot(gl.losses_)
plt.show()
Total running time of the script: ( 0 minutes 12.679 seconds)